


COPYRIGHT © 2016-2026. The Owl Teacher | Privacy page | Disclosure Page | Shipping | Returns/Refunds
Most of us, including me at the time, are pretty skilled at using manipulatives. Base ten blocks? Took them out in September. Tiles for fractions? Lived next to the math games in a plastic shoebox. Counters, snap cubes, and maybe a couple of laminated number lines? Check.
But here’s something most of us don’t do all the time: use visual models that really get students to move from “hands-on” to “minds-on.” And I understand. It’s easy to overlook visual models because they don’t come in a box, don’t occupy space on the classroom shelf, and aren’t part of your math program’s scripted curriculum. But that’s the problem: we’re skipping the most important link between concrete understanding and abstract reasoning.
According to the Concrete–Representational–Abstract (CRA) framework, manipulatives are part of the concrete stage of learning. However, the next step is often skipped or rushed: the representational stage, also known as visual models. These are powerful diagram-based tools that enable students to visualize relationships and patterns, rather than act them out. In this post, we’ll explore five visual models that go far beyond typical manipulatives. They’re research-backed, NCTM-supported, and classroom-tested for helping students reason, justify, and genuinely understand math—not just get answers.
What are Visual Models, Really?
To be clear, visual models are more than just cute pictures. They’re structured representations that help students “see” how math works, how things are related, and how to perform math operations without actually manipulating objects.
They belong to the Representational stage of the Concrete–Representational–Abstract (CRA) learning progression (Witzel, Riccomini, & Schneider, 2008). In other words, students need a visual bridge, such as a number line, strip diagram, or open array, to transition from the concrete stage, where they learn by manipulating objects, to the symbolic stage, where they learn by using symbols.
Van de Walle et al. (2013) suggest that using various visual models helps students understand structure, encourages flexibility, and prevents them from learning only procedures.
Why Aren’t Teachers Using Visual Models More?
Simple. We weren’t taught how to use them.
In most undergraduate teacher prep programs, we learned how to follow the steps—not how to teach students to think flexibly or visually. And unless your curriculum explicitly builds in these tools (spoiler: most don’t), it’s easy to skip the step between manipulatives and procedures.
Another reason? Visual models often look “basic,” so we assume they’re just for younger students or struggling learners.
But here’s what the research actually says:
- Visual models help all students, not just those below grade level (Gersten et al., 2009).
- They reduce the achievement gap in multi-step problem solving and fraction reasoning (Fuchs et al., 2013).
- They are essential for building conceptual understanding, which is a cornerstone of NCTM’s Principles to Actions (2014).
If we want our students to retain, transfer, and apply their learning, then visual models aren’t optional—they’re foundational.
5 Visual Models That Work Across All Math Concepts
The good news? You don’t need to use 25 different models. Just a few versatile, flexible ones can support most of the math you teach in grades 3–5. These models appear in research, standards-based frameworks, and brain-based instructional practices—and they don’t require special materials.
Each of these models is:
- Research-based
- Easy to sketch or implement
- Usable across multiple domains (fractions, operations, measurement, and more)
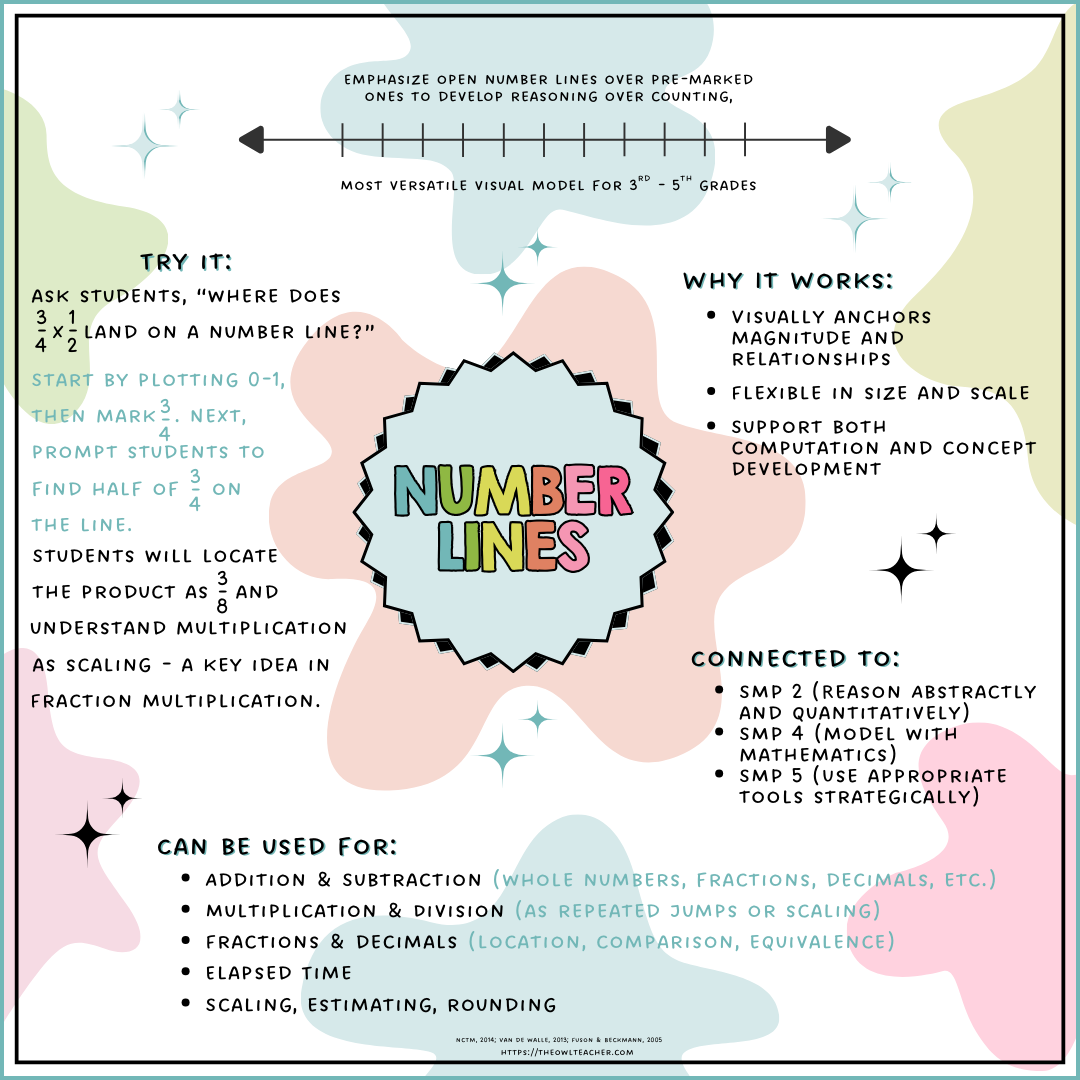
1. Number Lines
The number line is hands-down one of the most underutilized tools in the upper elementary math classroom—and yet it offers some of the most powerful opportunities for deep, conceptual understanding. Whether you’re helping students compare fractions, scale quantities, estimate products, or model elapsed time, number lines make magnitude and relationships visible in a way that abstract numbers alone never could. Instead of memorizing rules for multiplying by fractions, for example, students can literally see that 3/4 × 1/2 equals 3/8—smaller than either factor—reinforcing the idea of multiplication as scaling. According to Behr, Lesh, Post, and Silver (1983), number lines help students build a mental number system, especially when they draw and manipulate them themselves. They offer a flexible entry point into both operations and reasoning, promoting quantitative understanding without relying on step-by-step algorithms. When used consistently, number lines support student growth across multiple standards and engage them in both visual modeling and mental math, aligning with NCTM’s call for multiple representations and SMP 2, 4, and 5.
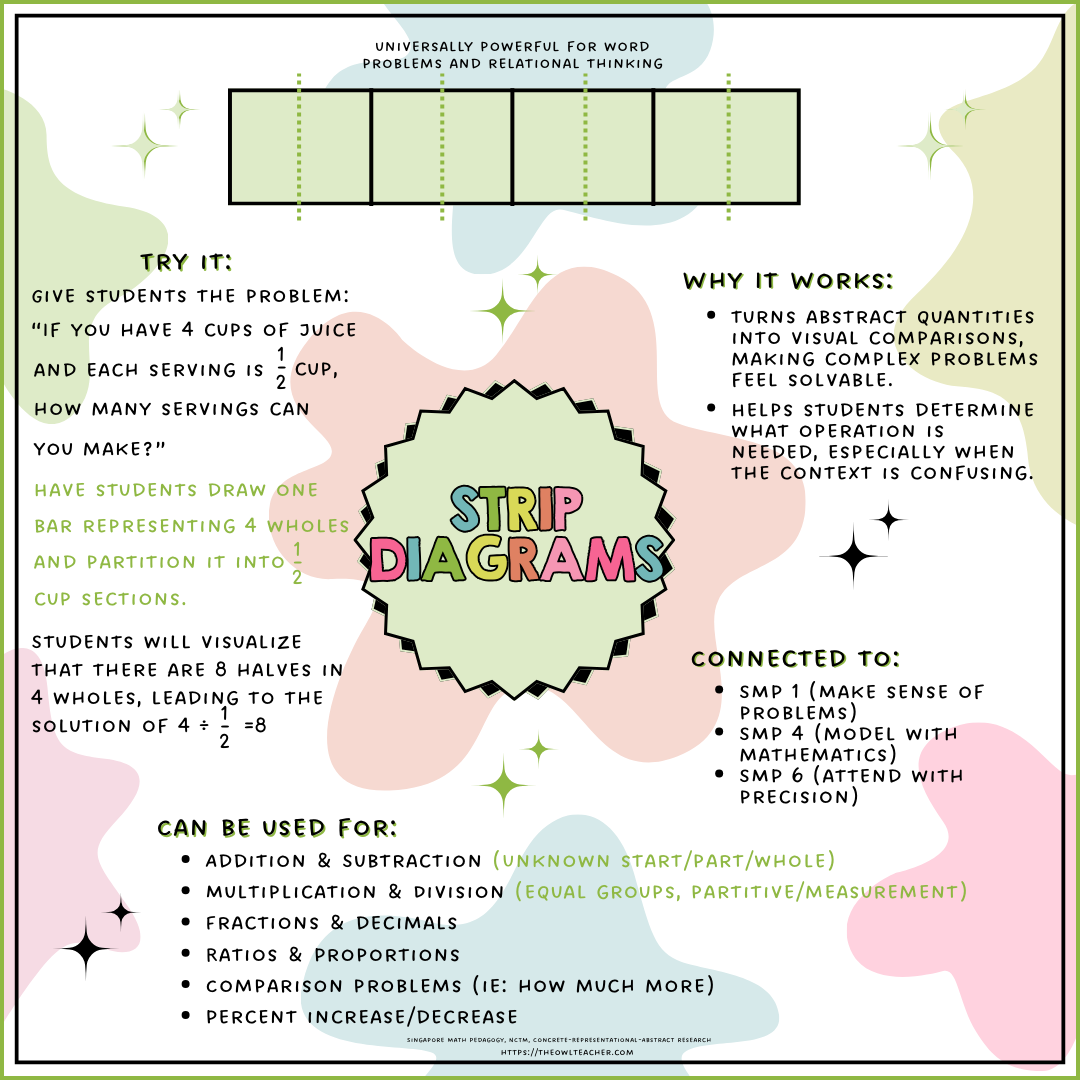
2. Strip Diagrams (Bar Models)
Strip diagrams—also called bar models—have long been a staple in Singapore Math, but they’re surprisingly absent from most U.S. classrooms, especially beyond third grade. These simple, rectangular visuals enable students to represent unknown quantities, compare values, and break down complex problems in a clear, visual manner. In division problems involving fractions or in multi-step comparison tasks, strip diagrams make the math feel accessible. Take a word problem like “You have 4 cups of trail mix, and each serving is 1/2 cup. How many servings can you make?” A strip diagram shows four whole units, each split into halves, and instantly, students can see that there are eight servings in total. This tool enables students to grasp partitive and measurement division, which is essential for developing a comprehensive understanding of fractional operations. Research by Fuchs et al. (2009) on schema-based instruction found that visual models, such as strip diagrams, significantly improve students’ performance on word problems, particularly among those who struggle with this type of problem. They help students identify what’s known, what’s unknown, and how the quantities relate—without immediately reaching for a keyword-based shortcut. This model builds both comprehension and precision, aligning tightly with SMP 1, 4, and 6.
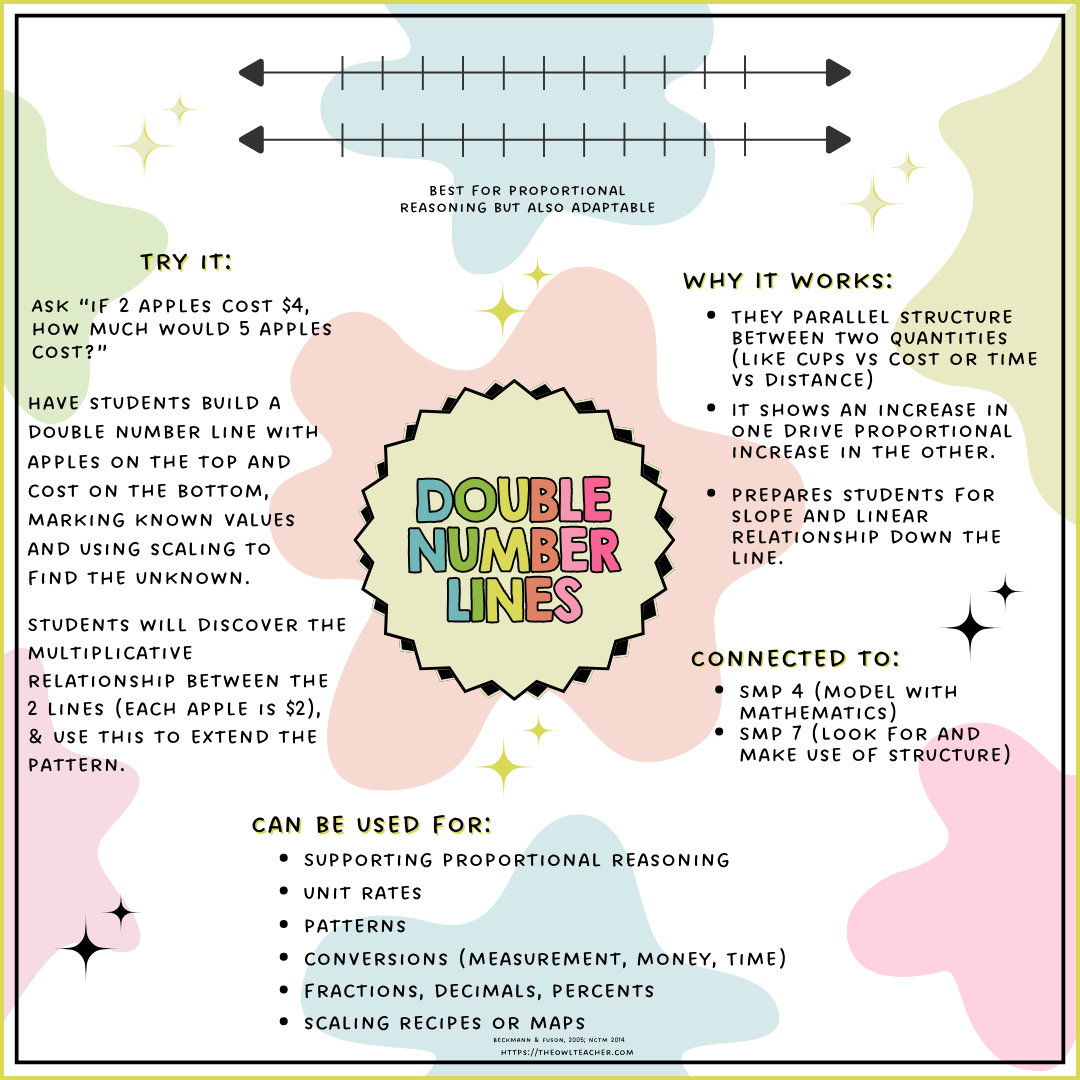
3. Double Number Lines
Double number lines are a representational powerhouse when it comes to proportional reasoning, but they’re often overlooked outside of sixth grade. Yet their power lies in the way they visually align two quantities—such as apples and dollars, or cups and teaspoons—on parallel tracks, showing exactly how one quantity scales in relation to another. When students map values like “2 apples for $4” and extend the line to 5 apples, they’re not just finding a price—they’re discovering a relationship. They see that every additional apple adds $2, and that doubling or halving one value affects the other proportionally. This model facilitates multiplicative thinking far more intuitively than relying on cross-multiplication or tables. Beckmann and Fuson (2005) emphasize that double number lines support deep understanding of ratios and unit rates by preserving the measurement structure between two sets. They’re especially valuable in helping students move from additive to multiplicative reasoning, and they’re a natural fit for measurement conversions, recipes, and real-world word problems. This model supports SMP 4 and 7 and prepares students for algebraic proportionality far earlier than traditional methods allow.
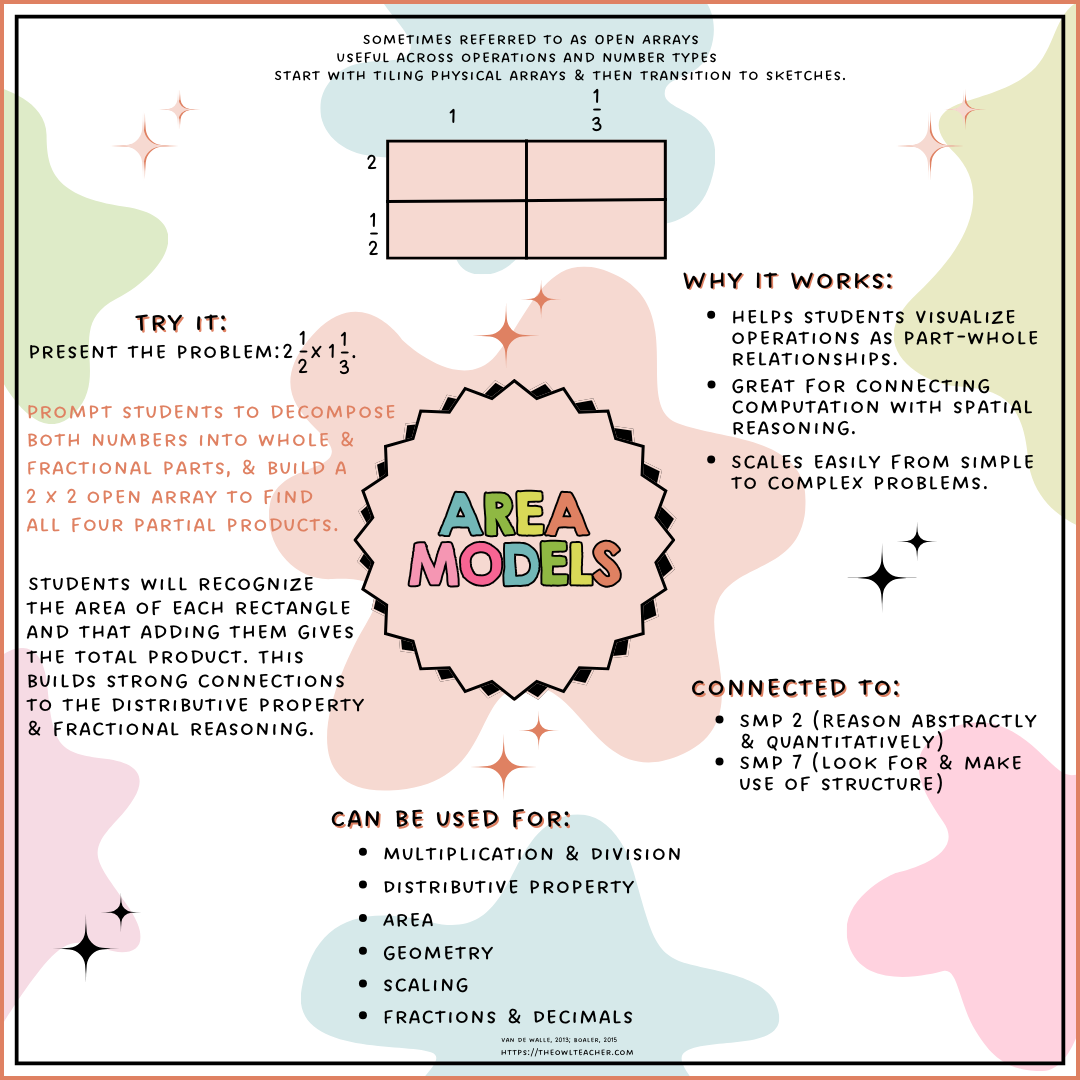
4. Open Arrays (Area Models)
Open arrays are a visual model that deserves far more classroom time than they typically get, especially given how well they support the transition from arithmetic to algebraic thinking. While they’re often associated with multiplication, their strength lies in their flexibility. Students can use open arrays to model multi-digit multiplication, fraction multiplication, area, and even partial quotients. They’re beneficial in showing how numbers break apart and come back together. For example, when solving 2 1/2 x 1 1/3, students can construct a 2 × 2 array with each factor split into whole and fractional parts. They then compute four partial areas and add them together, discovering that fractional multiplication isn’t about crossing fingers—it’s about recognizing patterns in parts. Van de Walle et al. (2013) note that this type of visual model builds structural awareness and promotes flexibility with operations. By providing students with a physical means to articulate their reasoning, open arrays support SMP 2 and 7 while also alleviating the cognitive overload that arises from trying to hold multiple numbers and steps in one’s head.
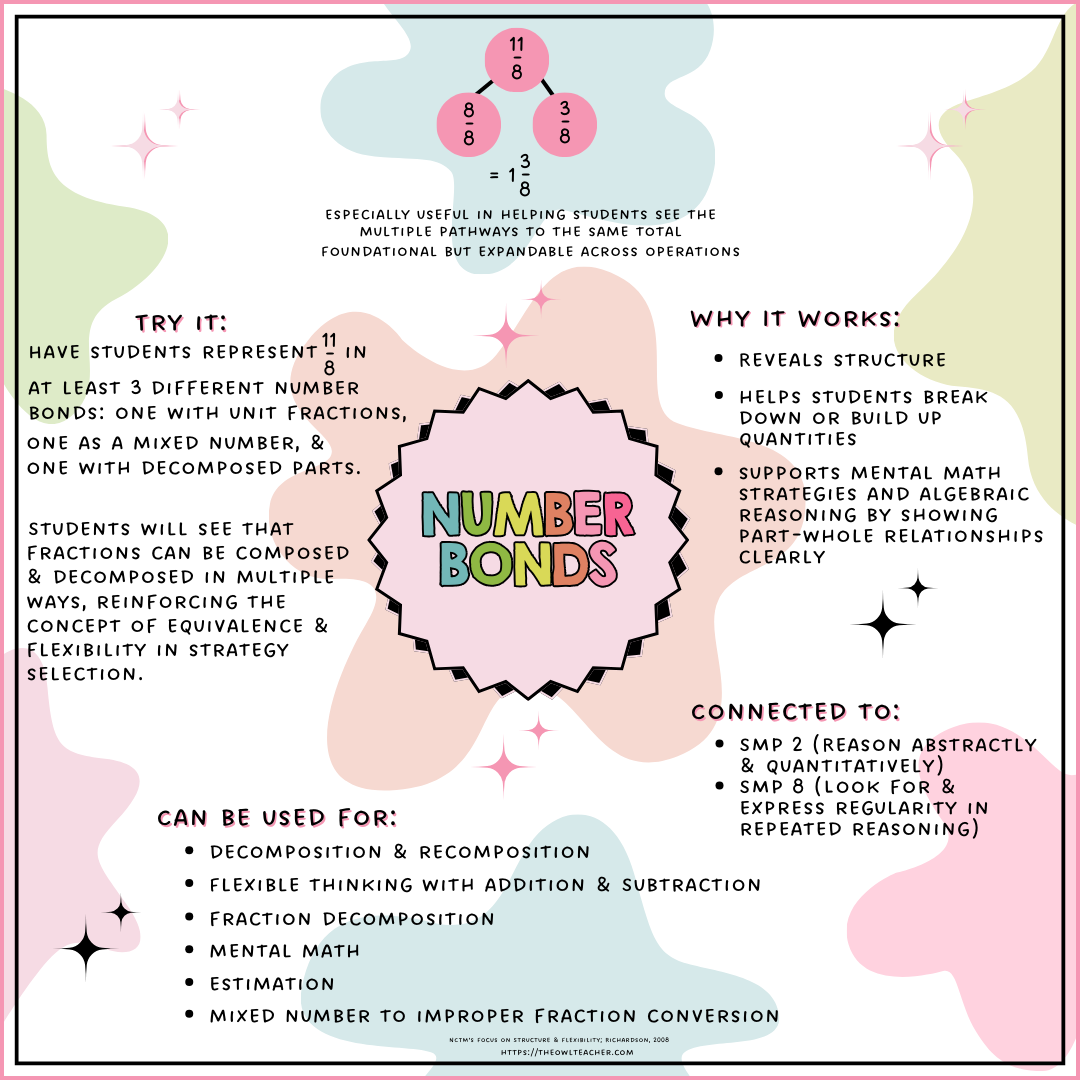
5. Number Bonds
Too often relegated to early elementary math, number bonds are one of the most underrated visual models for building fraction flexibility and mental computation in upper grades. At their core, number bonds help students visualize how a whole can be broken into parts—and that principle applies just as much to 7/4 as it does to 10. In fraction work, number bonds become tools for decomposing improper fractions, converting between forms, and adding or subtracting with unlike parts. A student might represent 7/4 as a mixed number: 1 + 3/4 or break it into unit fractions like 1/4 + 1/4 + 1/4 + 1/4 + 1/4 + 1/4 + 1/4, or as a sum of two fractions: 4/4 + 3/4. Either way, they’re using structure, not rules. According to Richardson (2008), number bonds encourage students to see multiple solution paths and develop a stronger conceptual understanding of equivalence, making them essential for differentiated instruction. When students regularly use number bonds to break down and recombine values, they develop fluency—not through memorization, but through the effective use of strategies. This model supports SMP 2 and 8, helping students move confidently between visual reasoning and symbolic manipulation.
What Happens When You Start Using Visual Models?
When teachers consistently use visual models—not just for one unit or intervention but as part of daily instruction—students begin to:
- Understand why an operation works, not just how to perform it
- Transfer knowledge across topics (e.g., seeing multiplication patterns in fractions)
- Engage in meaningful math talk using visuals as evidence
- Solve complex problems without shutting down
It also empowers teachers to differentiate without adding layers of prep. A number line or strip diagram becomes the go-to support for all students—not just those who are behind.
This Isn’t About Adding One More Thing
Using visual models isn’t a bonus strategy—it’s a core part of building conceptual understanding. In fact, NCTM (2014) clearly states that representations should be used regularly, not limited to intervention or early grades.
So whether you’re reteaching fraction division, launching a unit on ratios, or trying to clean up your math block once and for all—start with a model. Let your students see the math, because the best math tool isn’t always in the supply closet; sometimes, it’s just a marker and a blank piece of paper. If you’re ready to try out my math workshop series, where you don’t need to worry about best practices, check out this free set that’s differentiated for grades 3-5.

Grab a Free Reference Chart – No Signing Up Required!
Sources Cited:
- Beckmann, S., & Fuson, K. (2005). “Focus on Fractions.” Research Companion to Principles and Standards for School Mathematics.
- Carpenter, T. P., Fennema, E., Franke, M. L., Levi, L., & Empson, S. B. (1999). Children’s Mathematics: Cognitively Guided Instruction.
- Fuchs, L. S., Fuchs, D., Craddock, C. et al. (2008). “Effects of Schema-Based Instruction on Word Problem Solving.” Journal of Educational Psychology, 100(3), 640–656.
- Gersten, R. et al. (2009). Assisting Students Struggling with Mathematics: Response to Intervention (RtI) for Elementary and Middle Schools. Institute of Education Sciences.
- Lamon, S. J. (1999). Teaching Fractions and Ratios for Understanding: Essential Content Knowledge and Instructional Strategies for Teachers.
- National Council of Teachers of Mathematics (2014). Principles to Actions: Ensuring Mathematical Success for All.
- Van de Walle, J. A., Karp, K. S., & Bay-Williams, J. M. (2013). Elementary and Middle School Mathematics: Teaching Developmentally.
- Witzel, B. S., Riccomini, P. J., & Schneider, E. (2008). “Implementing CRA with Secondary Students.” Intervention in School and Clinic, 43(5), 270–276.