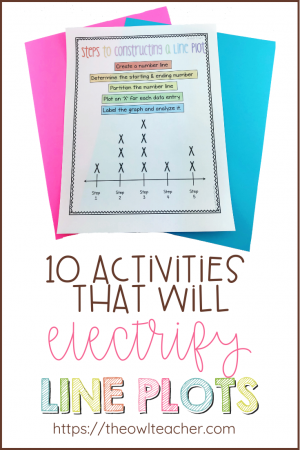
Line plots are taught in second, third, fourth, and fifth grade. It’s a celebrity in the elementary math field of data analysis and measurement. So as we watch it shimmer and sparkle in the bright lights, waving at all its fans– wait, fans? Exactly. I’m not certain there are a lot of fans when it comes to learning or teaching line plots. So what activities can we use to make lifelong fans of this superstar? Let’s examine that…
Superstar Activities
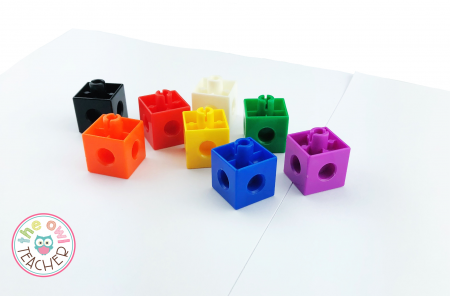
1.) Place 5 different colors of unicubes in a brown bag and draw them out. Tally the results until all 5 have been picked. Teach students that the number of picks go on the x-axis and the frequency is placed on the y-axis. Instead of using unicubes, use the number of letters in everyone’s first name.
2.) Consider measuring ten different items in your desk and ordering the lengths from greatest to least. Then create a line plot using those lengths measured. If you have to measure to the nearest whole, round up or down.
3.) Go to your local craft store (or supermarket like Walmart) and purchase some fake flowers. Cut the “stems” to different lengths. Have students measure them and create a line plot. To save money, group students or create stations around the room with an individual “flower.” If you don’t want to purchase fake flowers, go for straws. They work just as well.
4.) Body parts. Every kiddo loves to measure their body parts. Have students create line plots based on the measurement of their index fingers as a class or some other body part. This could be the length of their arm, the length of their foot, the length of their thumb. You get the picture.
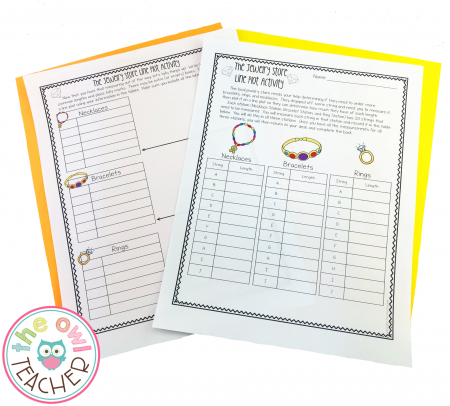
5.) One activity that we did in my measurement math workshop was we created “necklaces,” “bracelets,” and “rings” using string as though we were a jewelry shop. Assign each group with a specific type of jewelry. For instance, one group will create necklaces, while another group will create bracelets. Then provide them with yarn or some string. Give them specific measurements that they need to create using the string. Have them measure and cut string to that length. Afterward, they need to create a line plot and create math questions related to their line plot. For extra fun, have them present their line plot on chart paper or butcher paper.
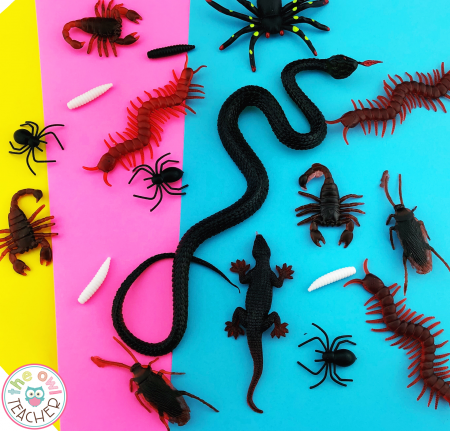
6.) Creepy crawly things excite nearly every kid, but to keep you from wanting to scream, pick up some fake bugs at your local dollar store. Have your kiddos measure the various lengths and then create a line plot that way. I got (Affiliate Link) this pack on Amazon because it guaranteed a variety of lengths.
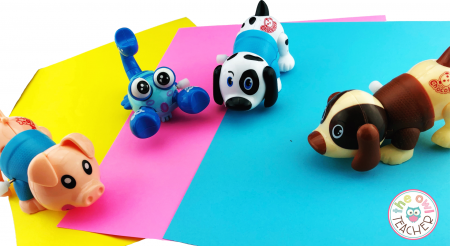
7.) Consider grabbing some of those old fashioned toys, such as (Affiliate Link) wind-up toys or pull back cars. Your students will definitely have a blast as they are “racing” them and then measuring the distance they traveled. Once the race is over, have them plot their distances on a line plot.

8.) Long, long ago, in newspapers, they had these reports on the weather. They often included the 7-day forecast. Create something similar, but include information such as how many inches of snow or rain a particular region is getting for that week. (It’s make-believe so have some fun!) For an extra challenge, place the amount in decimals and have your students convert it to fractions first before placing it on a line plot. (Do a whole month if you feel up to it!)
9.) As part of a plant unit, grow sunflower plants (or some other exciting plant) and take frequent measurements of it as it grows. Like daily. Then, have students create a line plot on its growth. Even better, create one large class chart.
10.) Have students keep track of the length of time they read (or completed their homework) each night for a set amount of time. Then, if desired, convert that to a fraction, and create a line plot individually, as a group, or as a whole class.
A Few Tips About Line Plots
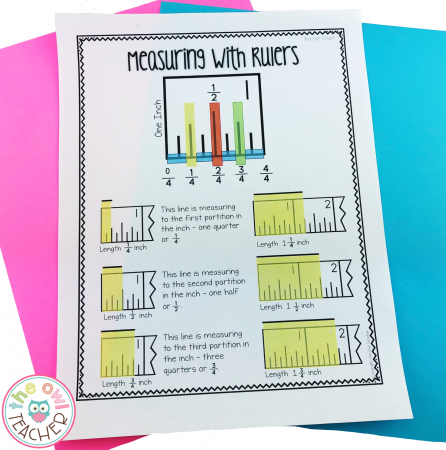
- Always make sure that you are modeling to students how to measure and create line plots.
- When measuring fractions, practice giving an image of a ruler and marking off increments of 1/2, 1/4, 1/8 from different points.
- Don’t just create a line plot. Ask questions afterward. For instance, could this be represented in another type of graph? What interpretations can you make? What label must be put on the x-axis?
- Don’t be afraid to have students create math questions and problems related to the line plot.
- Students don’t always have to measure when it comes to creating line plots. Sometimes it’s okay for you to just give data.
When it’s time for you to introduce your students to line plot tasks, these activities will definitely be winners for your students regardless if they are in 2nd, 3rd, 4th or 5th grade!


