


COPYRIGHT © 2016-2026. The Owl Teacher | Privacy page | Disclosure Page | Shipping | Returns/Refunds
It doesn’t seem to matter how long I’ve been teaching–it’s been decades now, and the word “graphing” still makes me think of stuffy business professionals charting the latest data and analyzing their sales. Numbers and pie charts and percentages… Boring, right?
Not on my watch! If you’re perpetually tired like me–and as teachers, who isn’t tired?–then the last thing you need is a boring day of math lessons. I live by a pretty strict motto in my classroom: if I’m bored, then my students are bored. And, well, we all know how well students learn when they’re bored (spoiler alert: they don’t)!
I’m not saying my classroom is nothing but parties and fun times, of course. I’m simply saying that engagement is the way to go! If you wouldn’t want to sit through a monotone lecture about all the different graphs and their uses, then why should you subject your students to that?
The good news is: you don’t have to! Graphing can be just as engaging and hands-on as any other math lesson. Whether you’re looking for a big whole-class project, or something simple and quick, I’ve got you covered.
1. Graphing the Kids!
We all know about hands-on activities… But what about feet-on activities?
Okay, so that doesn’t really have quite the same ring to it. Let’s forget I said that.
What I mean is: get those students up and moving! Have students sort themselves as if they’re points on a line plot and the whole classroom is their graph. This can be a bit time-intensive, so I find that this activity is best done when you’ve got the time for something a bit bigger than a quick lesson.
When setting up, you can either have all the desks moved to the sides of the room so that there’s empty space on the ground, or you can leave the desks where they are and have students just swap seats as needed. Then, on the whiteboard, I would write several different categories. Some easy examples are shirt colors, hair colors, birth months, and so on. Then, students can line up under each category that they fit into.
Once students have organized themselves, either take a picture or record tallies for the number of students in each category so that your kiddos can observe the data that they’ve created and make their own line plots! How’s that for being involved in graphing?
However, if you don’t have a big enough space for students to gather near the whiteboard, no worries. A simple solution is to have students create something to represent themselves, such as a sticky note with their name or something even cuter, like persona glyphs. Then, students can stick their creations to the whiteboard under the appropriate category. This way, students can also see the data for themselves from their seats while creating their line plots. And they’re reusable, too, in case you want to create a few more sets of data!
With this activity, it’s important to remind your students the purpose behind line plots. Communicate to them that we are organizing data in a concise manner that is easy to understand at a glance. Counting plot points on a graph is certainly much easier than going around the room and asking everyone a question, right? In addition, you should ensure that you are using (and encouraging!) academic language when exploring the graphs.
Whichever way you choose to help your students explore line plots, one thing is for sure: with this interactive task, your kiddos will be able to forge that self-to-concept connection that we strive to develop. Nothing helps students connect to data like becoming the data!
2. A Sweet Taste of Graphing
Alright, alright, I know, I’m about to break rule number one of teaching: don’t sugar up the kids! Once in a while is okay, though, right? Besides, it’s important for the sake of graphing!
…Well, maybe just try to do this activity later in the day. 😉
This is a pictograph activity that I do every year, and the kids are always engaged! It’s super easy. In fact, I’ve even mentioned it before! I usually use M&Ms or gummy bears, but you could use plenty of other cute food items, such as Froot Loops, Smarties, or even Veggie Straws if you’re looking for a not-so-sweet option. Basically, just grab something that your kiddos can sort by color!
At the beginning of the lesson block, I hand out personal-sized candy baggies (or just a handful of the candy if you don’t have the fun-sized versions) so that everyone has the same number of candies with a random assortment of colors. Then, everyone sorts their candies based on color and we create pictographs! This activity is great for exploring the key. For an added challenge, encourage your students to create keys where one picture does NOT equal one candy.
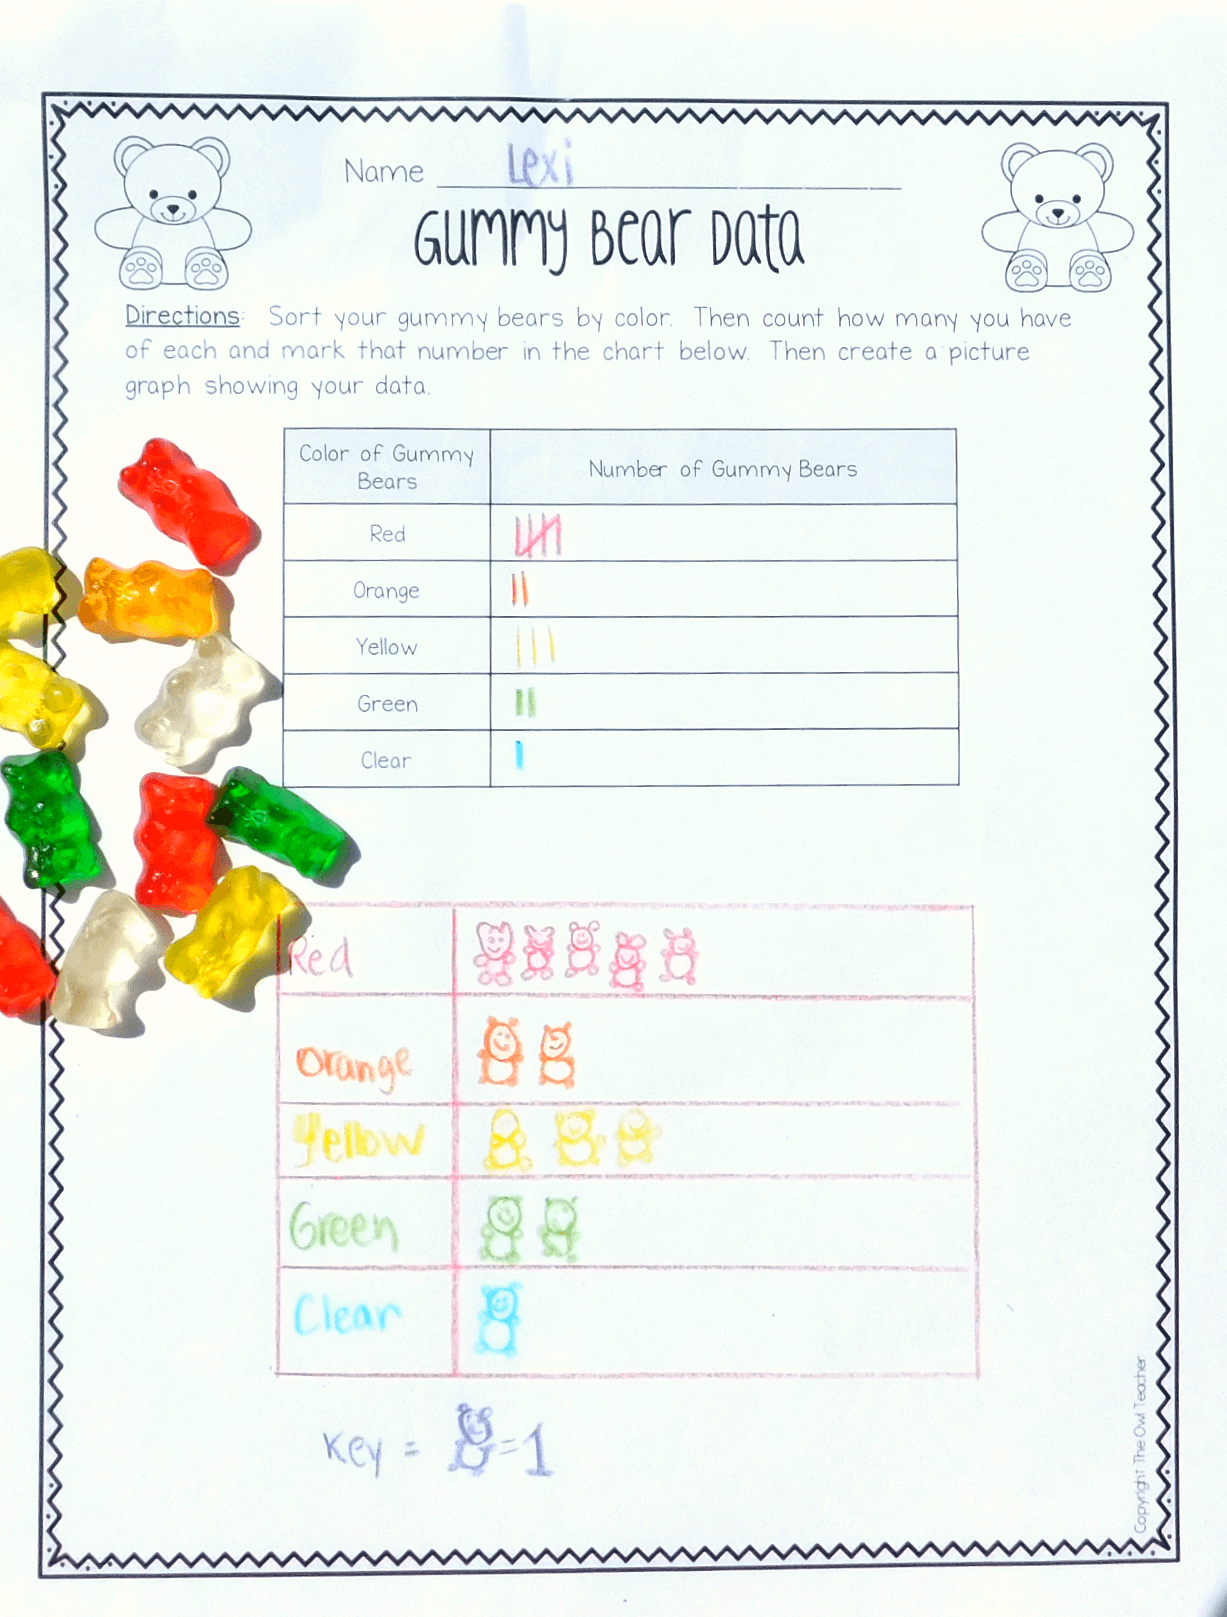
Of course, if you have other ideas for a pictograph, no worries. This sweet activity can be used for several other graphs, such as number charts, bar graphs, tally charts, and line plots. The possibilities are as numerous as the colors!
3. Thumbs Up for Graphing!
Thumbs up… And fingers, too! We’re going to measure it all! It’s time to make some graphs.
Since it can be difficult to create line graphs in real time (such as by measuring the growth of a plant over time), I tend to eliminate time completely from line graphs. Instead, I like to use measurements of the students in order to help develop that self-to-world connection.
In this activity, I have students use rulers to measure the length of their thumbs. Then, on the whiteboard, I first create a tally chart of thumb measurements, then use that data to create a bar graph. If you wanted to take this a step further, you could break students up into groups of four or five and have them measure another finger, their arm, or their feet to create another graph. This way, you’ll be able to move around the room to check for understanding.
If this activity sounds a bit familiar, that’s because it is! You can find this activity (along with tons more) in my graphing math workshop. I love how simple and quick it is–it’s a perfect fit for those days where you’re crunched for time in your math block. Besides, this resource is certainly… Hands-on! Get it?
4. Picture-Perfect Graphing
I know pictographs were mentioned above, but if you don’t want to spend the money or time picking up the extra candy (and who could blame you?), this is a great alternative. All you need are sticky notes, and who doesn’t have plenty of those stockpiled up?! Sure, they may be a commodity–I hate giving mine away!–but it’s for a good cause. 🙂
For this activity, I give each student a sticky note. On the whiteboard, I write a few different playground activities: swings, slides, monkey bars, tag, kickball, or whatever else your school has. Make sure to write these vertically so they can serve as your Y-axis for a pictograph!
Then, I ask students to draw a simple image of their favorite activity out of the ones I listed on the board. After a few moments, students will come stick their sticky notes to the board next to whichever activity they drew a picture of.
At first, I create a normal key where one picture equals one instance of a favorite activity. However, it’s easy to move sticky notes around and remove some to adjust the key as needed to help your students understand the ins and outs of a pictograph.
Ultimately, the most important thing is for students to see their own data being converted into graphing, and to encourage them to think critically about where their data can be applied. What can we do with this newly-created pictograph? Can we show the principal and ask them to build more slides, or whatever other activities that students like the best? Brainstorm the different ways that your graphs can be applied to real life!
Graphing always sounds like such a monumental task, especially when you factor in all the different types of graphing that you have to explore. However, with these easy-to-implement hands-on activities, your students will be line plotting–I mean, lining up for more!
Most of the activities above can be used for multiple different types of graphs, and there are plenty more activities out there for students to explore graphing in a way that best suits them. Ultimately, it’s your classroom, and you know your kiddos best! Teaching in a way that can connect with each student will always be beneficial in the long run. Set those students up for success now by laying a strong graphing foundation!
Now go chart a course for a great graphing lesson!
